filter-stations
Installation
To install the package, run the following command in your terminal:
pip install -U filter-stations
Getting Started
All methods require an API key and secret, which can be obtained by contacting TAHMO.
- The
retreive_dataclass is used to retrieve data from the TAHMO API endpoints.
- The
Filterclass is used to filter weather stations data based on things like distance and region. - The
pipelineclass is used to create a pipeline of filters to apply to weather stations based on how they correlate with water level data. - The
Interactive_mapsclass is used to plot weather stations on an interactive map. - The
Water_levelclass is used to retrieve water level data and coordinates of gauging stations.
# Import the necessary modules
from filter_stations import retreive_data, Filter, pipeline, Interactive_maps

# Define the API key and secret
apiKey = 'your_api_key' # request from TAHMO
apiSecret = 'your_api_secret' # request from TAHMO
maps_key = 'your_google_maps_key' # retrieve from google maps platform

# Initialize the class
ret = retreive_data(apiKey, apiSecret, maps_key)
fs = Filter(apiKey, apiSecret, maps_key)
pipe = pipeline(apiKey, apiSecret, maps_key)
maps = Interactive_maps(apiKey, apiSecret, maps_key)
Retrieves information about weather stations from an API endpoint and returns relevant information based on the parameters passed to it.
Parameters:
- station (str, optional): Code for a single station to retrieve information for. Defaults to None.
- multipleStations (list, optional): List of station codes to retrieve information for multiple stations. Defaults to [].
- countrycode (str, optional): Country code to retrieve information for all stations located in the country. Defaults to None.
Returns:
- pandas.DataFrame: DataFrame containing information about the requested weather stations.
Usage:
To retrieve information about a single station:
station_info = ret.get_stations_info(station='TA00001')
To retrieve information about multiple stations:
station_info = ret.get_stations_info(multipleStations=['TA00001', 'TA00002'])
To retrieve information about all stations in a country:
station_info = ret.get_stations_info(countrycode='KE')
Retrieve longitudes,latitudes for a list of station_sensor names and duplicated for stations with multiple sensors.
Parameters:
- station_sensor (list): List of station_sensor names.
- normalize (bool): If True, normalize the coordinates using MinMaxScaler to the range (0,1).
Returns:
- pd.DataFrame: DataFrame containing longitude and latitude coordinates for each station_sensor.
Usage:
To retrieve coordinates
start_date = '2023-01-01'
end_date = '2023-12-31'
country= 'KE'

# get the precipitation data for the stations
ke_pr = filt.filter_pr(start_date=start_date, end_date=end_date,
                        country='Kenya').set_index('Date')

# get the coordinates
xs = ret.get_coordinates(ke_pr.columns, normalize=True)
Retrieves information about available weather variables from an API endpoint.
Returns:
- dict: Dictionary containing information about available weather variables, keyed by variable shortcode.
Returns a dictionary of the nearest neighbouring stations to the specified station.
Parameters:
- station (str): Code for the station to find neighbouring stations for.
- number (int, optional): Number of neighbouring stations to return. Defaults to 5.
Returns:
- dict: Dictionary containing the station codes and distances of the nearest neighbouring stations.
Retrieves the status of all weather stations
Returns:
- pandas.DataFrame: DataFrame containing the status of all weather stations.
Retrieves trained models from the MongoDB.
Parameters:
- columns (list of str, optional): List of column names to include in the returned DataFrame. If None, all columns are included. Defaults to None.
Returns:
- pandas.DataFrame: DataFrame containing trained models with the specified columns.
Aggregates a pandas DataFrame of weather variables by applying a specified method across a given frequency.
Parameters:
- dataframe (pandas.DataFrame): DataFrame containing weather variable data.
- freq (str, optional): Frequency to aggregate the data by. Defaults to '1D'. Examples include '1H' for hourly, '12H' for every 12 hours, '1D' for daily, '1W' for weekly, '1M' for monthly, etc.
method (str or callable, optional): Method to use for aggregation. Defaults to 'sum'. Acceptable string values are 'sum', 'mean', 'min', 'max'. Alternatively, you can provide a custom aggregation function (callable).
Example of a custom method: <div class="pdoc-code codehilite"> <pre><span></span><code><span class="k">def</span> <span class="nf">custom_median</span><span class="p">(</span><span class="n">x</span><span class="p">):</span> <span class="k">return</span> <span class="n">np</span><span class="o">.</span><span class="n">nan</span> <span class="k">if</span> <span class="n">x</span><span class="o">.</span><span class="n">isnull</span><span class="p">()</span><span class="o">.</span><span class="n">all</span><span class="p">()</span> <span class="k">else</span> <span class="n">x</span><span class="o">.</span><span class="n">median</span><span class="p">()</span> <span class="n">daily_median_data</span> <span class="o">=</span> <span class="n">aggregate_variables</span><span class="p">(</span><span class="n">dataframe</span><span class="p">,</span> <span class="n">freq</span><span class="o">=</span><span class="s1">'1D'</span><span class="p">,</span> <span class="n">method</span><span class="o">=</span><span class="n">custom_median</span><span class="p">)</span> </code></pre> </div>
Returns:
- pandas.DataFrame: DataFrame containing aggregated weather variable data according to the specified frequency and method.
Usage:
Define the DataFrame containing the weather variable data:
dataframe = ret.get_measurements('TA00001', '2020-01-01', '2020-01-31', ['pr']) # data comes in 5 minute interval
To aggregate data hourly:
hourly_data = aggregate_variables(dataframe, freq='1H')
To aggregate data by 12 hours:
half_day_data = aggregate_variables(dataframe, freq='12H')
To aggregate data by day:
daily_data = aggregate_variables(dataframe, freq='1D')
To aggregate data by week:
weekly_data = aggregate_variables(dataframe, freq='1W')
To aggregate data by month:
monthly_data = aggregate_variables(dataframe, freq='1M')
To use a custom aggregation method:
def custom_median(x):
    return np.nan if x.isnull().all() else x.median()

daily_median_data = aggregate_variables(dataframe, freq='1D', method=custom_median)
Aggregate quality flags in a DataFrame by day.
Parameters:
- dataframe (pd.DataFrame): The DataFrame containing the measurements.
Returns:
- pd.DataFrame: A DataFrame with aggregated quality flags, where values greater than 1 are rounded up.
Get measurements from a station.
Parameters:
- station (str): The station ID.
- startDate (str, optional): The start date of the measurement period in the format 'YYYY-MM-DD'.
- endDate (str, optional): The end date of the measurement period in the format 'YYYY-MM-DD'.
- variables (list, optional): The variables to retrieve measurements for. If None, all variables are retrieved.
- dataset (str, optional): The dataset to retrieve measurements from. Default is 'controlled'.
- aggregate (bool, optional): Whether to aggregate the measurements by variable. Default is False.
- quality_flags (bool, optional): Whether to include quality flag data. Default is False.
Returns:
- A DataFrame containing the measurements.
Usage:
To retrieve precipitation data for a station for the last month:
from datetime import datetime, timedelta

# Get today's date
today = datetime.now()

# Calculate one month ago
last_month = today - timedelta(days=30)

# Format date as a string
last_month_str = last_month.strftime('%Y-%m-%d')
today_str = today.strftime('%Y-%m-%d')

# Define the station you want to retrieve data from
station = 'TA00001'
variables = ['pr']
dataset = 'raw'

# aggregate the data to 30 minutes interval
aggregate = '30min'

# Call the get_measurements method to retrieve and aggregate data
TA00001_data = ret.get_measurements(station, last_month_str,
                                    today_str, variables,
                                    dataset, aggregate)
Retrieves measurements for multiple stations within a specified date range.
Parameters:
- stations_list (list): A list of strings containing the codes of the stations to retrieve data from.
- startDate (str): The start date for the measurements, in the format 'yyyy-mm-dd'.
- endDate (str): The end date for the measurements, in the format 'yyyy-mm-dd'.
- variables (list): A list of strings containing the names of the variables to retrieve.
- dataset (str): The name of the database to retrieve the data from. Default is 'controlled' alternatively 'raw' database.
- csv_file (str, optional): pass the name of the csv file to save the data otherwise it will return the dataframe.
- aggregate (bool): If True, aggregate the data per day; otherwise, return data in 5 minute interval.
Returns:
- df (pandas.DataFrame): A DataFrame containing the aggregated data for all stations.
Raises:
- ValueError: If stations_list is not a list.
Example Usage:
To retrieve precipitation data for stations in Kenya for the last week and save it as a csv file:
# Import the necessary modules
from datetime import datetime, timedelta
from filter_stations import retreive_data

# An instance of the retreive_data class
ret = retreive_data(apiKey, apiSecret, maps_key)

# Get today's date
today = datetime.now()

# Calculate one week ago
last_week = today - timedelta(days=7)

# Format date as a string
last_week_str = last_week.strftime('%Y-%m-%d')
today_str = today.strftime('%Y-%m-%d')

# Define the list of stations you want to retrieve data from example stations in Kenya
stations = list(ret.get_stations_info(countrycode='KE')['code'])

# Get the precipitation data for the stations in the list
variables = ['pr']

# retrieve the raw data for the stations, aggregate the data and save it as a csv file
dataset = 'raw'
aggregate = '1D'
csv_file = 'Kenya_precipitation_data'

# Call the multiple_measurements method to retrieve and aggregate data
aggregated_data = ret.multiple_measurements(stations, last_week_str,
                                            today_str, variables,
                                            dataset, csv_file, aggregate)
Retrieves and aggregates quality flag data for multiple stations within a specified date range.
Parameters:
- stations_list (list): A list of station codes for which to retrieve data.
- startDate (str): The start date in 'YYYY-MM-DD' format.
- endDate (str): The end date in 'YYYY-MM-DD' format.
- csv_file (str, optional): The name of the CSV file to save the aggregated data. Default is None.
Returns:
- pandas.DataFrame or None: A DataFrame containing the aggregated quality flag data for the specified stations, or None if an error occurs.
Raises: Exception: If an error occurs while retrieving data for a station.
Retrieves anomaly reports for a specified date range.
Parameters:
- start_date (str): The start date for the report in 'yyyy-mm-dd' format.
- end_date (str, optional): The end date for the report in 'yyyy-mm-dd' format. If not provided, only data for the start_date is returned.
Returns:
- pandas.DataFrame: A DataFrame containing anomaly reports with columns 'startDate', 'station_sensor', and 'level'. The 'startDate' column is used as the index.
Raises:
- Exception: If there's an issue with the API request.
Usage:
To retrieve anomaly reports for a specific date range:
start_date = '2023-01-01'
end_date = '2023-01-31'
report_data = ret.anomalies_report(start_date, end_date)
To retrieve anomaly reports for a specific date:
start_date = '2023-01-01'
report_data = ret.anomalies_report(start_date)
Retrieves ground truth data for a specified date range.
Parameters:
- start_date (str): The start date for the report in 'yyyy-mm-dd' format.
- end_date (str, optional): The end date for the report in 'yyyy-mm-dd' format. If not provided, only data for the start_date is returned.
Returns:
- pandas.DataFrame: A DataFrame containing ground truth data with columns 'startDate', 'station_sensor', 'description' and 'level'. The 'startDate' column is used as the index.
Raises:
- Exception: If there's an issue with the API request.
Usage:
To retrieve ground truth data for a specific date range:
start_date = '2023-01-01'
end_date = '2023-01-31'
report_data = ret.ground_truth(start_date, end_date)
To retrieve ground truth data for a specific date:
start_date = '2023-01-01'
report_data = ret.ground_truth(start_date)
Retrieves weather data from the Kieni API endpoint and returns it as a pandas DataFrame after processing.
Parameters:
- start_date (str, optional): The start date for retrieving weather data in 'YYYY-MM-DD' format. Defaults to None if None returns from the beginning of the data.
- end_date (str, optional): The end date for retrieving weather data in 'YYYY-MM-DD' format. Defaults to None if None returns to the end of the data.
- variable (str, optional): The weather variable to retrieve same as the weather shortcodes by TAHMO e.g., 'pr', 'ap', 'rh'
- method (str, optional): The aggregation method to apply to the data ('sum', 'mean', 'min', 'max' and custom functions). Defaults to 'sum'.
- freq (str, optional): The frequency for data aggregation (e.g., '1D' for daily, '1H' for hourly). Defaults to '1D'.
Returns:
- pandas.DataFrame: DataFrame containing the weather data for the specified parameters, with columns containing NaN values dropped.
Usage:
To retrieve daily rainfall data from January 1, 2024, to January 31, 2024:
# Instantiate the Kieni class
api_key, api_secret = '', '' # Request DSAIL for the API key and secret
kieni = Kieni(api_key, api_secret)

kieni_weather_data = kieni.kieni_weather_data(start_date='2024-01-01', end_date='2024-01-31', variable='pr', freq='1D', method='sum')
To retrieve hourly temperature data from February 1, 2024, to February 7, 2024:
kieni_weather_data = kieni.kieni_weather_data(start_date='2024-02-01', end_date='2024-02-07', variable='te', method='mean', freq='1H')
Retrieves stations within a specified radius from a given latitude and longitude.
Parameters:
- radius (float): Radius (in kilometers) within which to search for stations.
- latitude (float): Latitude of the center point.
- longitude (float): Longitude of the center point.
- df (bool, optional): Flag indicating whether to return the result as a DataFrame. Defaults to False.
Returns:
- DataFrame or list: DataFrame or list containing the stations within the specified radius. If df is True, a DataFrame is returned with the columns 'code', 'location.latitude', 'location.longitude', and 'distance'. If df is False, a list of station codes is returned.
Performs a data check on the stations' data and returns the stations with a percentage of missing data below a threshold.
Parameters:
- stations_list (list): List of station names or IDs.
- percentage (float, optional): Threshold percentage of missing data. Defaults to 1 (i.e., 0% missing data allowed).
- start_date (str, optional): Start date for the data range in the format 'YYYY-MM-DD'. Defaults to None.
- end_date (str, optional): End date for the data range in the format 'YYYY-MM-DD'. Defaults to None.
- data (DataFrame, optional): Preloaded data for the stations. Defaults to None.
- variables (list, optional): List of variables to consider for the data check. Defaults to ['pr'].
- csv_file (str, optional): File name for saving the data as a CSV file. Defaults to None.
Returns:
- DataFrame: DataFrame containing the stations' data with less than the specified percentage of missing data.
Calculates the lag and coefficient of correlation between weather station data and water level data, identifying stations with positive correlations.
Parameters:
- weather_stations_data (DataFrame): A DataFrame containing weather station data columns for analysis.
- water_level_data (Series): A time series of water level data used for correlation analysis.
- lag (int): The maximum lag, in hours, to consider for correlation. Default is 3 hours.
- above (float or None): If specified, stations with correlations and lags above this threshold are identified.
- below (float or None): If specified, stations with correlations and lags below this threshold are identified.
Returns:
- above_threshold_lag (dict): A dictionary where keys represent weather station column names, and values represent the lag in hours if positive correlation exceeds the specified threshold (above).
- below_threshold_lag (dict): A dictionary where keys represent weather station column names, and values represent the lag in hours if positive correlation falls below the specified threshold (below).
Filters and processes weather station data to identify stations potentially contributing to water level changes above or below specified thresholds.
Parameters:
- weather_stations_data (DataFrame): A DataFrame containing weather station data over a specific date range.
- water_level_data (Series): A time series of water level data corresponding to the same date range as weather_station_data.
- gauging_station_coords (tuple): A tuple containing latitude and longitude coordinates of the gauging station.
- radius (float): The radius in kilometers for identifying nearby weather stations.
- lag (int): The time lag, in hours, used for correlation analysis. Default is 3 hours.
- percentage (float): The minimum percentage of valid data required for a weather station to be considered. Default is 1 (100%).
- above (float or None): The threshold above which water level changes are considered significant. If provided, stations contributing to changes above this threshold are identified.
- below (float or None): The threshold below which water level changes are considered significant. If provided, stations contributing to changes below this threshold are identified.
Returns:
- above_threshold_lag (list): List of weather stations with positive correlations and lagged changes above the specified threshold.
- below_threshold_lag (list): List of weather stations with positive correlations and lagged changes below the specified threshold.
Usage:
Get the TAHMO stations that correlate with the water level data
import pandas as pd
from filter_stations import pipeline

# An instance of the pipeline class
pipe = pipeline(apiKey, apiSecret, maps_key)

# load the water level data and the weather stations data
water_level_data = pd.read_csv('water_level_data.csv')
weather_stations_data = pd.read_csv('weather_stations_data.csv')

# get the coordinates of the gauging station
gauging_station_coords = (-0.416, 36.951)

# get the stations within a radius of 200km from the gauging station
radius = 200

# get the stations that correlate with the water level data
above_threshold_lag, below_threshold_lag = pipe.shed_stations(weather_stations_data, water_level_data,
                                                              gauging_station_coords, radius,
                                                              lag=3, percentage=1)
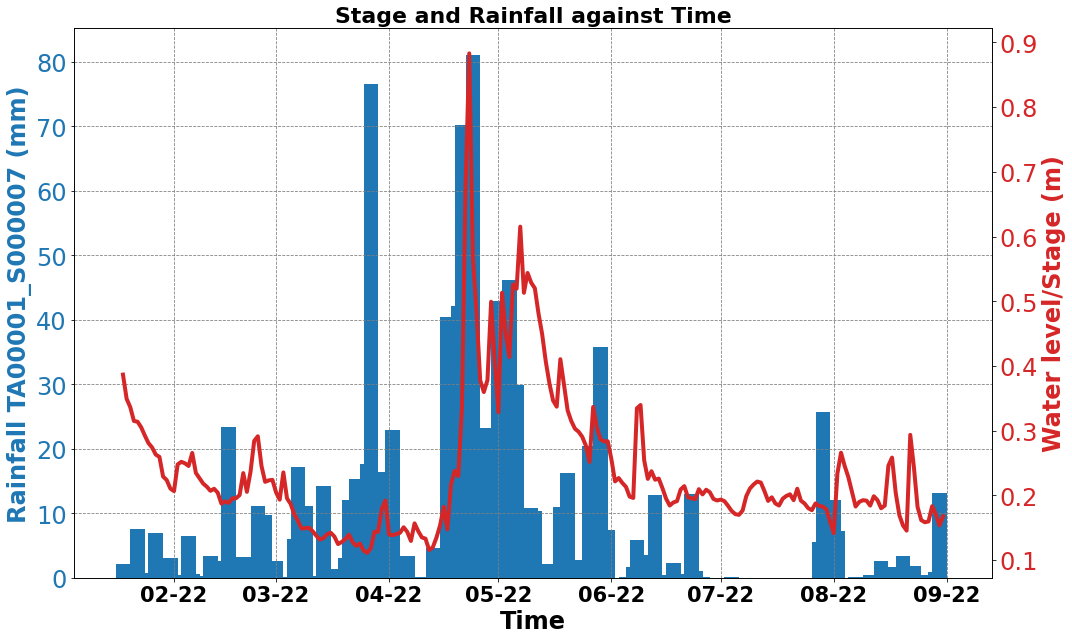
Plots figures showing the relationship between rainfall and water level/stage against time.
Parameters:
- weather_stations (DataFrame): DataFrame containing weather station data.
- water_list (list): List of water levels/stages.
- threshold_list (list): List of columns in the weather_stations DataFrame to plot.
- save (bool, optional): Flag indicating whether to save the figures as PNG files. Defaults to False.
- dpi (int, optional): Dots per inch for saving the figures. Defaults to 500.
- date (str, optional): Start date for plotting in the format 'dd-mm-yyyy'. Defaults to '11-02-2021'.
Returns:
- Displays the images of the plots. and if save is set to true saves the images in the current directory.
Retrieves information about weather stations from an API endpoint and returns relevant information based on the parameters passed to it.
Parameters:
- station (str, optional): Code for a single station to retrieve information for. Defaults to None.
- multipleStations (list, optional): List of station codes to retrieve information for multiple stations. Defaults to [].
- countrycode (str, optional): Country code to retrieve information for all stations located in the country. Defaults to None.
Returns:
- pandas.DataFrame: DataFrame containing information about the requested weather stations.
Usage:
To retrieve information about a single station:
station_info = ret.get_stations_info(station='TA00001')
To retrieve information about multiple stations:
station_info = ret.get_stations_info(multipleStations=['TA00001', 'TA00002'])
To retrieve information about all stations in a country:
station_info = ret.get_stations_info(countrycode='KE')
This method retrieves the latitude and longitude coordinates of a given address using the Google Maps Geocoding API.
Parameters:
- address : str The address of the location you want to retrieve the coordinates for.
- api_key : str Your Google Maps Geocoding API key.
Returns:
- Tuple (float, float) or None The latitude and longitude coordinates of the location if found, or None if the address is not found.
Calculates a new geographic point based on the given latitude, longitude, distance and bearing.
Parameters:
- lat (float): The latitude of the starting point in decimal degrees.
- lon (float): The longitude of the starting point in decimal degrees.
- distance (float): The distance in kilometers from the starting point to the new point.
- bearing (float): The bearing in degrees from the starting point to the new point, measured clockwise from true north.
Returns:
- Tuple[float, float]: A tuple containing the latitude and longitude of the new point, respectively, in decimal degrees.
Calculates the bounding box coordinates for a given location and distance.
Parameters:
- lat (float): The latitude of the location.
- lon (float): The longitude of the location.
- distance (float): The distance from the location, in kilometers, to the edge of the bounding box.
Returns:
- A tuple containing four floats representing the bounding box coordinates: (min_lat, min_lon, max_lat, max_lon).
This method filters weather station data within a certain distance from a given address.
Parameters:
- address (str): Address to center the bounding box around.
- distance (float): The distance (in kilometers) from the center to the edge of the bounding box.
- startDate (str): The start date for filtering the weather station data in the format 'YYYY-MM-DD'.
- endDate (str): The end date for filtering the weather station data in the format 'YYYY-MM-DD'.
- csvfile (str): The name of the csv file containing the weather station data.
Returns:
- pandas.DataFrame: The filtered weather station data within the bounding box.
Filters stations based on their proximity to a given address and returns a list of station codes that fall within the specified distance.
Parameters:
- address (str): Address to filter stations by.
- distance (float, optional): Maximum distance (in kilometers) between the stations and the address. Default is 100 km.
Returns:
- List of station codes that fall within the specified distance from the given address.
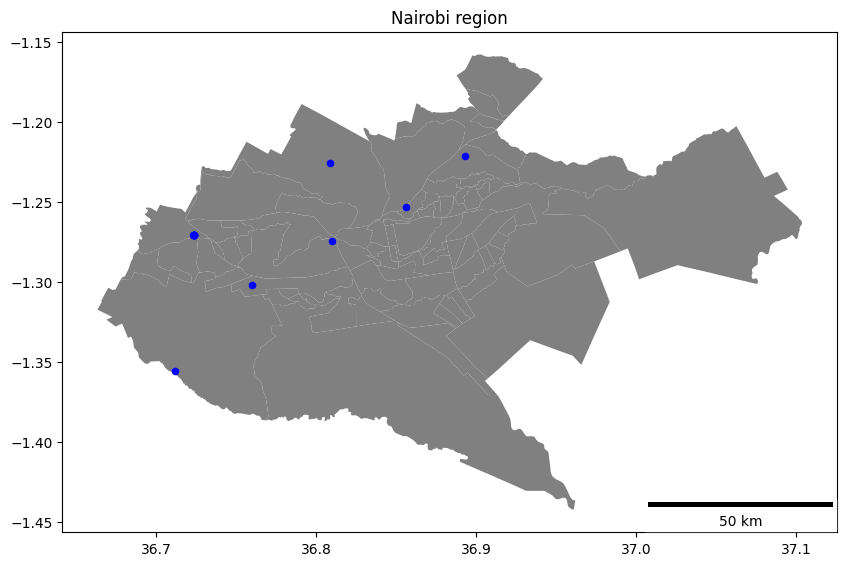
Subsets weather stations by a specific geographical region and optionally plots them on a map with a scale bar.
Parameters:
- region (str): The name of the region to subset stations from (47 Kenyan counties).
- plot (bool, optional): If True, a map with stations and a scale bar is plotted. Default is False.
Returns:
- list or None: If plot is False, returns a list of station codes in the specified region. Otherwise, returns None.
Usage:
To get a list of station codes in the 'Nairobi' region without plotting:
fs = Filter(api_key, api_secret, maps_key)  # Create an instance of your class
station_list = fs.stations_region('Nairobi')
To subset stations in the 'Nairobi' region and display them on a map with a scale bar:
fs = Filter(api_key, api_secret, maps_key)  # Create an instance of your class
fs.stations_region('Nairobi', plot=True)
Removes columns with all zeros from a DataFrame.
Parameters:
- df (DataFrame): The DataFrame to remove columns from.
Returns:
- DataFrame: The DataFrame with columns containing all zeros removed.
Retrieves precipitation data from BigQuery based on specified parameters.
Parameters:
- start_date (str): Start date for data query.
- end_date (str): End date for data query.
- country (str): Country name for filtering stations.
- region (str): Region name for filtering stations.
- radius (str): Radius for stations within a specified region.
- multiple_stations (str): Comma-separated list of station IDs.
- station (str): Single station ID for data filtering.
Returns:
- pd.DataFrame: A Pandas DataFrame containing the filtered precipitation data.
Usage:
To get precipitation data for a specific date range:
fs = Filter(api_key, api_secret, maps_key)  # Create an instance of your class
start_date = '2021-01-01'
end_date = '2021-01-31'
pr_data = fs.filter_pr(start_date, end_date)
To get precipitation data for a specific date range and country:
fs = Filter(api_key, api_secret, maps_key)  # Create an instance of your class
start_date = '2021-01-01'
end_date = '2021-01-31'
country = 'Kenya'
pr_data = fs.filter_pr(start_date, end_date, country=country)
To get precipitation data for a specific date range and region:
fs = Filter(api_key, api_secret, maps_key)  # Create an instance of your class
start_date = '2021-01-01'
end_date = '2021-01-31'
region = 'Nairobi'
pr_data = fs.filter_pr(start_date, end_date, region=region)
To get precipitation data for a specific date range and region with a radius:
fs = Filter(api_key, api_secret, maps_key)  # Create an instance of your class
start_date = '2021-01-01'
end_date = '2021-01-31'
region = 'Nairobi'
radius = 100
pr_data = fs.filter_pr(start_date, end_date, region=region, radius=radius)
To get precipitation data for a specific date range and multiple stations:
fs = Filter(api_key, api_secret, maps_key)  # Create an instance of your class
start_date = '2021-01-01'
end_date = '2021-01-31'
multiple_stations = ['TA00001', 'TA00002', 'TA00003']
pr_data = fs.filter_pr(start_date, end_date, multiple_stations=multiple_stations)
To get precipitation data for a specific date range and a single station:
fs = Filter(api_key, api_secret, maps_key)  # Create an instance of your class
start_date = '2021-01-01'
end_date = '2021-01-31'
station = 'TA00001'
pr_data = fs.filter_pr(start_date, end_date, station=station)
Generate clog flags DataFrame based on start and end dates.
Parameters:
- startdate (str): Start date in 'YYYY-MM-DD' format.
- enddate (str): End date in 'YYYY-MM-DD' format.
- flags_json (str, optional): Path to the JSON file containing clog flags data. Defaults to 'qualityobjects.json'.
- questionable (bool, optional): Whether to return questionable clog flags. Defaults to False.
- as_csv (bool, optional): Whether to save the resulting DataFrame as a CSV file. Defaults to False.
- csv_file (str, optional): Name of the CSV file to save. Only applicable if as_csv is True. Defaults to None.
Returns:
- pandas.DataFrame: DataFrame containing the clog flags.
Inherited Members
Creates a Folium map centered on the specified location and adds markers for each weather station in the area.
Parameters:
- map_center: a tuple with the latitude and longitude of the center of the map
Returns:
- A Folium map object
Creates an animation of pollutant levels for a given range of days and valid sensors.
Parameters:
- data (DataFrame): A pandas DataFrame containing station data defaults to none reads pr_clog_flags if none.
- sensors (list): A list of valid sensor names.
- day (int): The starting day of the animation (default is 100).
- T (int): The range of days for the animation (default is 10).
- interval (int): The interval between frames in milliseconds (default is 500).
Returns:
- HTML: An HTML object containing the animation.
Creates an animation of the predicted data on a grid over time.
Parameters:
- mu_pred (ndarray): The predicted data on a grid over time.
- xi (ndarray): The x-coordinates of the grid.
- xj (ndarray): The y-coordinates of the grid.
- valid_station_df (DataFrame): A DataFrame containing the information of the valid stations.
- clogged_station_df (DataFrame): A DataFrame containing the information of the clogged stations.
- T (int): The number of time steps.
Returns:
- HTML: The animation as an HTML object.
The animation as an MP4 file
Plot the rainfall data for a specific weather station.
Parameters:
- ws: string, the code of the weather station to plot
- df_rainfall: DataFrame, a pandas DataFrame with rainfall data
Returns:
- None if no data is available for the specified station
- a Matplotlib figure showing rainfall data for the specified station otherwise
Encodes a station's rainfall data plot as a base64-encoded image.
Parameters:
- ws (str): the code for the station to encode the image for
- df_rainfall (pandas.DataFrame): a DataFrame containing the rainfall data for all stations
Returns:
- str: a string containing an HTML image tag with the encoded image data, or a message indicating no data is available for the given station
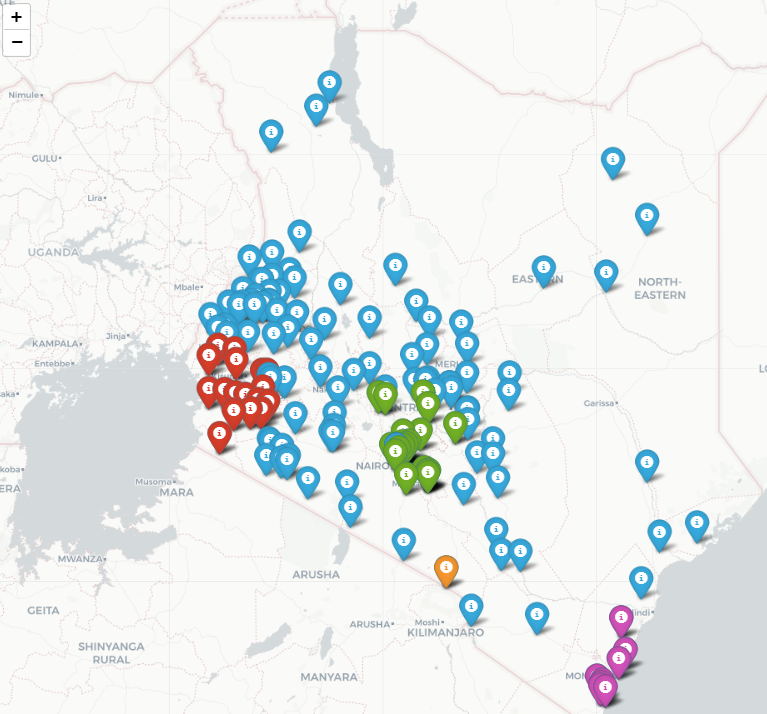
Creates a Folium map showing the locations of the weather stations in the given subsets.
Parameters:
- subset_list : list of lists of str List of subsets of weather stations, where each subset is a list of station codes.
- start_date : str, optional Start date in the format YYYY-MM-DD, default is None.
- end_date : str, optional End date in the format YYYY-MM-DD, default is None.
- data_values : bool, optional If True, the map markers will display a plot of rainfall data, default is False.
- csv_file : str, optional The name of the CSV file containing the rainfall data, default is 'pr_clog_flags.csv'.
- min_zoom : int, optional The minimum zoom level of the map, default is 8.
- max_zoom : int, optional The maximum zoom level of the map, default is 11.
- width : int, optional The width of the map in pixels, default is 850.
- height : int, optional The height of the map in pixels, default is 850.
- png_resolution : int, optional The resolution of the PNG image if data_values is True, default is 300.
Returns:
- my_map : folium.folium.Map A Folium map object showing the locations of the weather stations in the given subsets.
Get the latitude and longitude coordinates for a specified region.
Parameters:
- region (str): The region for which coordinates are requested. Valid values are 'muringato' or 'ewaso'.
Returns:
- tuple: A tuple containing the latitude and longitude coordinates.
Raises:
- ValueError: If the region provided is not 'muringato' or 'ewaso'.
Example:
# Example usage:
wl = Water_level()
coords = wl.coordinates('muringato')
print(coords)  # Output: (-0.406689, 36.96301)
Retrieve water level data for a specified region and optional date range.
Parameters:
- region (str): The region for which water level data is requested. Valid values are 'muringato' or 'ewaso'.
- start_date (str, optional): Start date for filtering the data. Format: 'YYYY-MM-DD'.
- end_date (str, optional): End date for filtering the data. Format: 'YYYY-MM-DD'.
Returns:
- pd.DataFrame: A Pandas DataFrame containing water level data with a DateTime index.
Raises:
- ValueError: If the region provided is not 'muringato' or 'ewaso'.
- ValueError: If the request to the API is not successful.
Usage:
from filter_stations import water_level
wl = Water_level()
# get water level data for the muringato gauging station
muringato_data = wl.water_level_data('muringato')
# get water level data for the ewaso gauging station
ewaso_data = wl.water_level_data('ewaso')
Transforms the station status data into a dictionary with date as the key and online status as the value.
Parameters:
- station_status (DataFrame): The original DataFrame containing 'id' and 'status' of the stations.
- today (datetime.date, optional): The date to be used as the index when the job is run. Default is the current date.
- transformed_data (bool, optional): If True, the data will be transposed and formatted. If False, the original DataFrame will be used with an additional 'Date' column. Default is True.
Returns:
- dict: A dictionary containing the transformed station status data.
Note:
If transformed_data is True: The returned dictionary will have the date (today) as the key and the number of stations online for that day as the value. Example: {datetime.date(2023, 7, 29): {1: True, 2: False, 3: True}}
If transformed_data is False: The returned dictionary will have each row of the original DataFrame with an additional 'Date' column. Example: {0: {'id': 1, 'online': True, 'Date': datetime.date(2023, 7, 29)}, 1: {'id': 2, 'online': False, 'Date': datetime.date(2023, 7, 29)}, 2: {'id': 3, 'online': True, 'Date': datetime.date(2023, 7, 29)}}